Visualization Functions for Search Strategy Analysis
Source:R/visualization-functions.R
plot_overview.RdThis file contains all visualization functions used by the SearchAnalyzer class and other components of the searchAnalyzeR package. Create Overview Performance Plot
Details
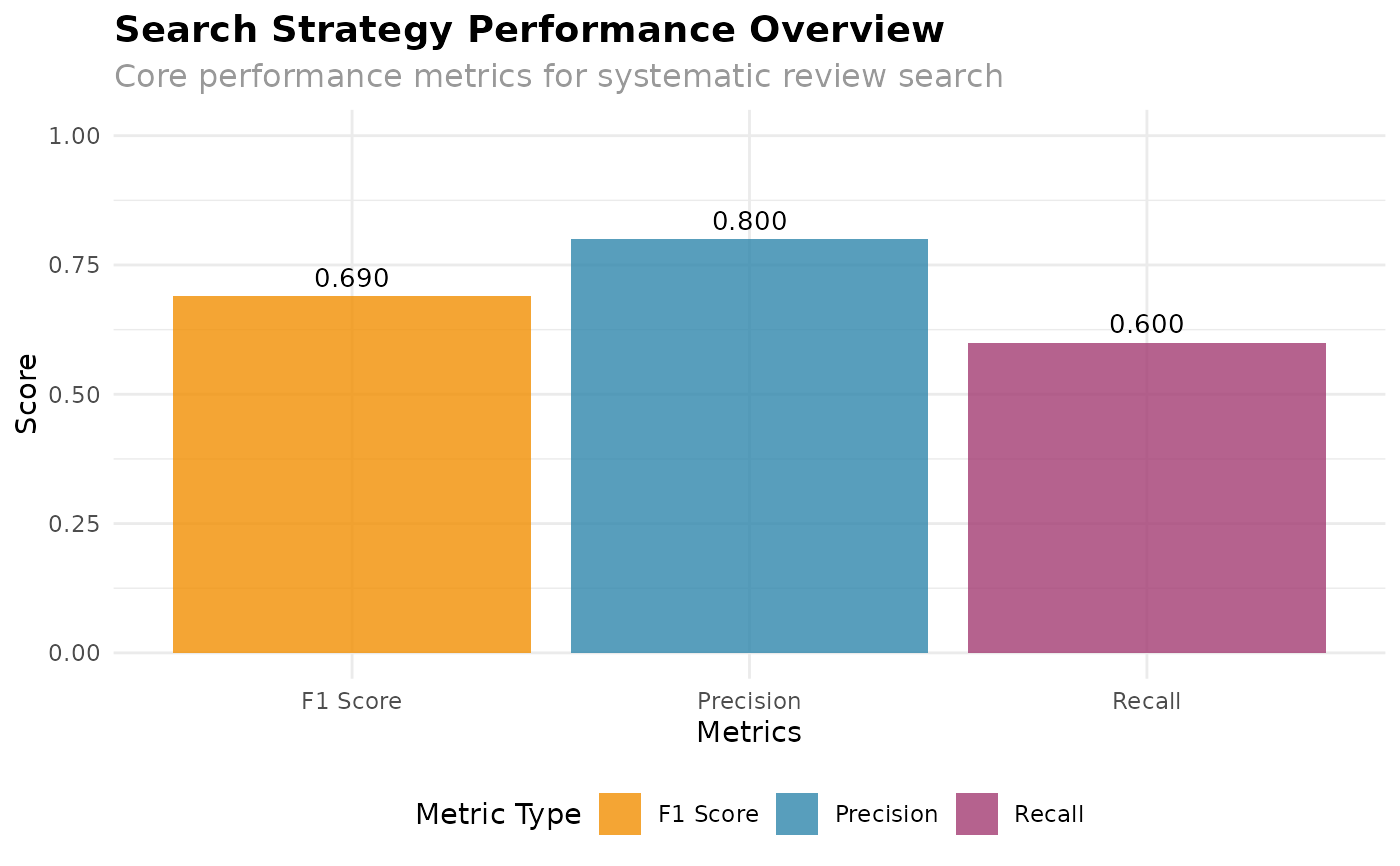
Creates a focused overview plot displaying the core search performance metrics:
Precision: Proportion of retrieved articles that are relevant
Recall: Proportion of relevant articles that were retrieved
F1 Score: Harmonic mean of precision and recall
The plot uses color coding to distinguish between metric types and displays exact values on top of each bar.