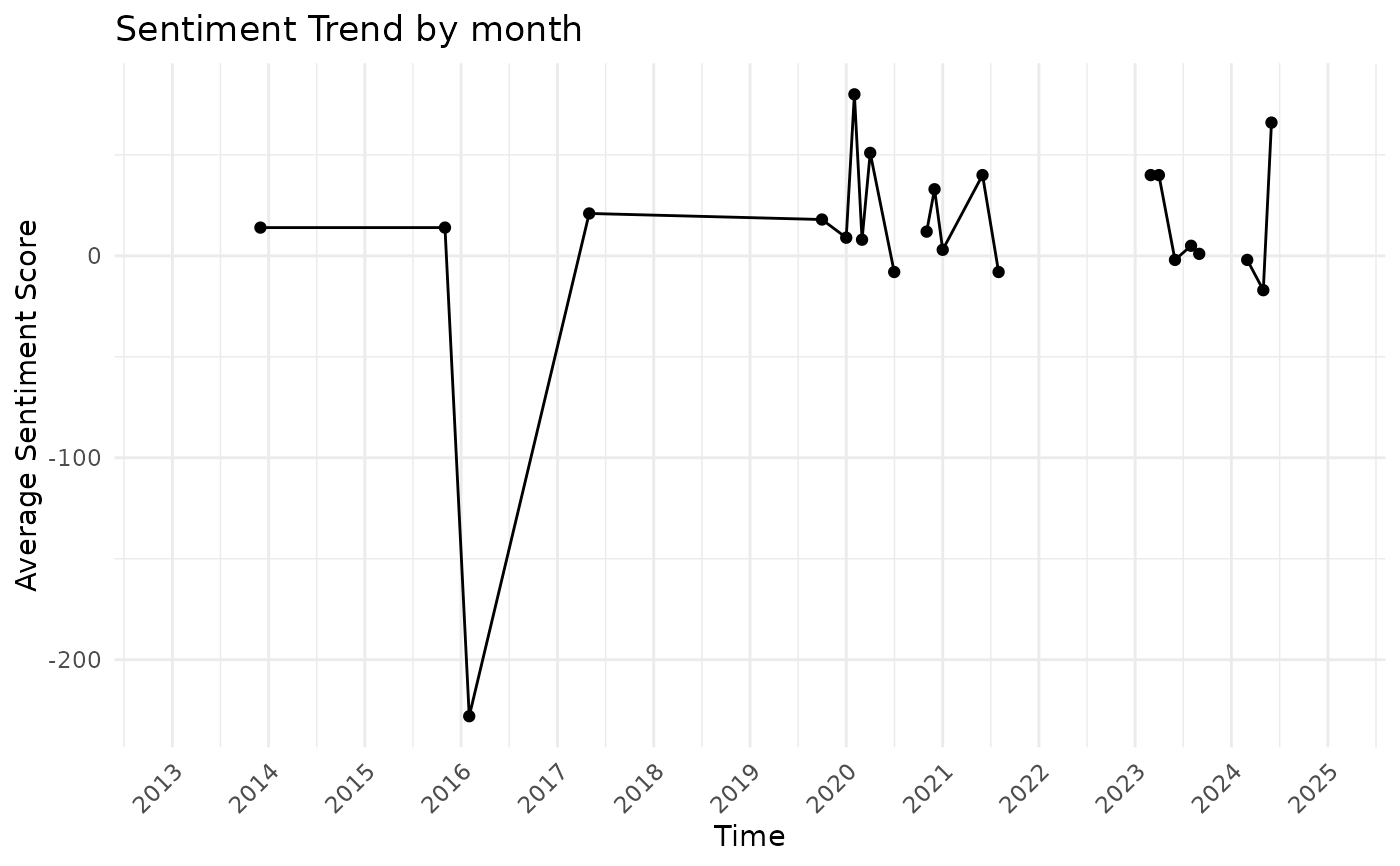
This function plots the average sentiment score over time.
Examples
# \donttest{
# Create a temporary file with sample book IDs
temp_file <- tempfile(fileext = ".txt")
writeLines(c("1420", "2767052", "10210"), temp_file)

# Run the scrape_reviews function
reviews <- scrape_reviews(temp_file, num_reviews = 10, use_parallel = FALSE)
#> Total book IDs to process: 3
#> 2025-06-29 03:56:44.245085 scrape_goodreads_reviews: Completed! All book reviews extracted
#> Scraping run time = 6.81999254226685
#> Total books processed: 3

# Check if reviews were successfully scraped
if (nrow(reviews) > 0) {
  # Perform sentiment analysis
  sentiment_results <- analyze_sentiment(reviews, lexicon = "afinn")

  # Create histogram of sentiment scores
  senti_trend <- sentiment_trend(sentiment_results)

  # Display the plot
  print(senti_trend)

  # Optionally, save the plot
  # ggsave("senti_trend.png", senti_trend, width = 8, height = 6)
} else {
  cat("No reviews found. Cannot create sentiment trend\n")
}
#> Warning: Removed 1 row containing missing values or values outside the scale range
#> (`geom_line()`).
#> Warning: Removed 5 rows containing missing values or values outside the scale range
#> (`geom_point()`).


# Clean up: remove the temporary file
file.remove(temp_file)
#> [1] TRUE
# }
# Clean up: remove the temporary file
file.remove(temp_file)
#> [1] TRUE
# }