Using the Text Annotation Interface
Chao Liu
2025-03-25
Source:vignettes/textAnnotatoR_gui.Rmd
textAnnotatoR_gui.RmdIntroduction
The Text Annotation Interface provides a comprehensive environment for qualitative data analysis through text annotation. This vignette will guide you through using the interface effectively, from basic text annotation to advanced features like code hierarchies and comparative analysis.
Getting Started
Launching the Interface
To start using the text annotation interface, simply call the
annotate_gui() function:
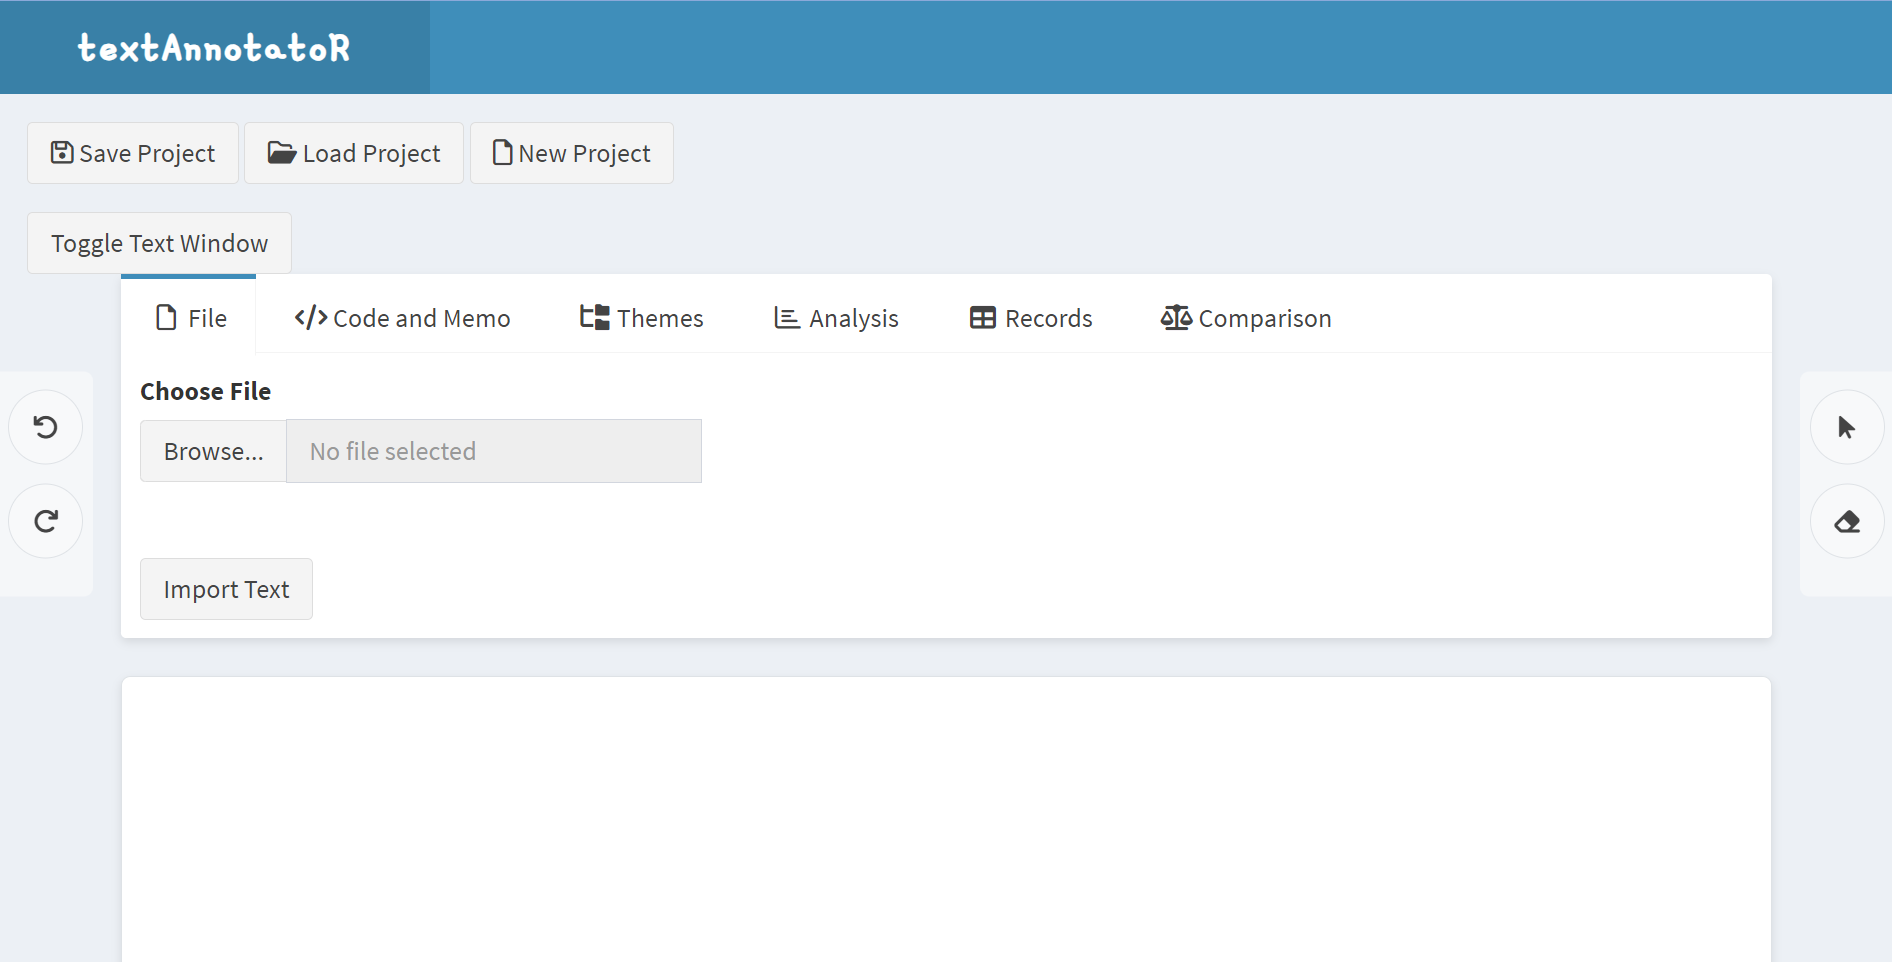
This will open the Shiny application in your default web browser. The interface is divided into several tabs, each offering different functionality for your annotation work.

Main Interface Overview
Basic Operations
Project Management
Creating a New Project
- Click the “New Project” button in the top toolbar
- If you have unsaved changes, you’ll be prompted to save them
- Confirm creation of the new project

New Project Dialog
Basic Annotation
Selecting Text
- Click the selection tool (cursor icon) in the right margin
- Click and drag across the text you want to annotate
- The selected text will be highlighted in yellow
Applying Codes
# Example of code application via the API (if available)
annotate_text(selected_text, code = "important_theme")- With text selected, you can:
- Enter a new code in the “Code” field
- Select an existing code from the dropdown
- Click “Apply Code” to annotate the selection
- The coded text will be highlighted with a unique color
Advanced Features
Code Management
Code Hierarchy
The “Themes” tab allows you to organize your codes hierarchically:
# Example of code hierarchy structure
codes <- list(
  "Methods" = c("Qualitative", "Quantitative"),
  "Results" = c("Findings", "Discussion")
)- Click “Add Theme” to create a new theme
- Use “Add Code to Theme” to organize existing codes
- The hierarchy is displayed in a tree structure
Merging Codes
# Example of code merging logic
merge_codes(c("code1", "code2"), new_code = "merged_code")- Click “Merge Codes” button
- Select the codes you want to merge
- Enter a name for the new merged code
- Confirm the merge
Analysis Tools
Code Frequency Analysis
# Example of frequency analysis
analyze_code_frequency(annotations)- Click “Code Frequency” in the Analysis tab
- View the bar chart showing code usage frequency
- Export results if needed
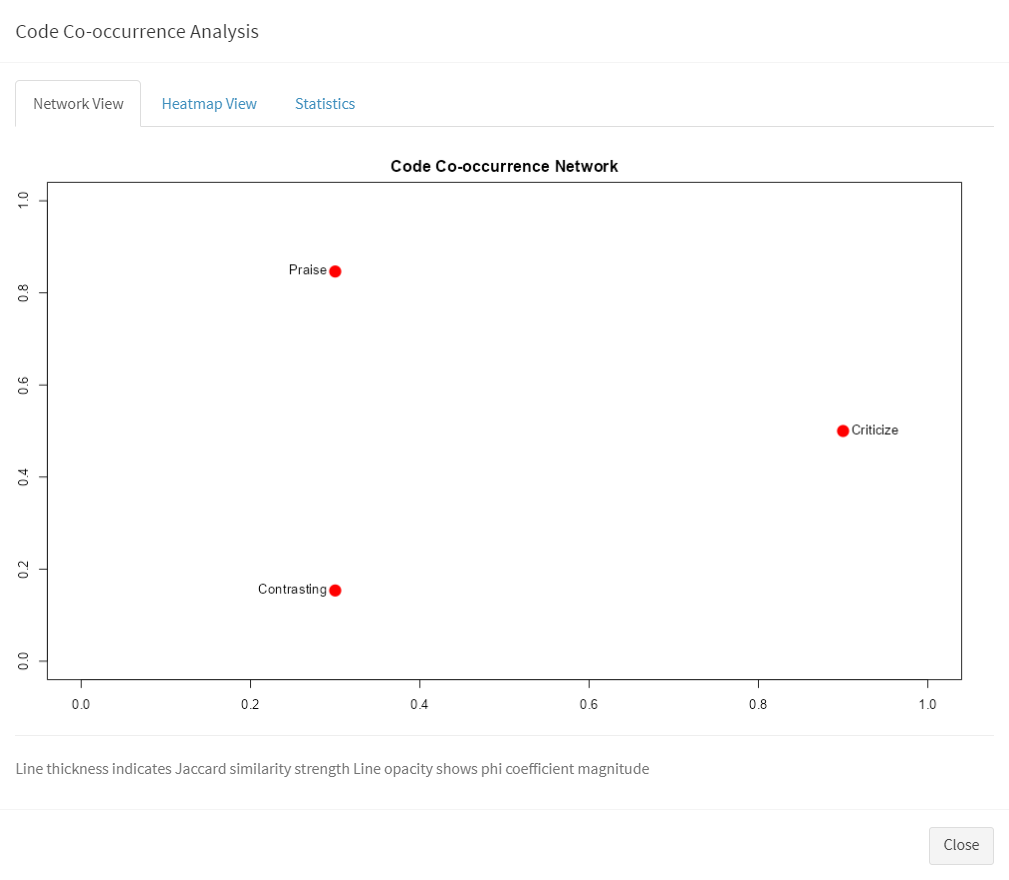
Code Co-occurrence Analysis
- Click “Code Co-occurrence”
- Examine the relationship between codes through:
- Network visualization
- Heatmap view
- Statistical summary

Code Co-occurrence Analysis
Text Summary
Generate basic statistics about your text and annotations:
# Example of summary statistics
summary_stats <- analyze_text(text, annotations)
print(summary_stats)Exporting Data
Best Practices
Organizing Your Work
- Create meaningful code names
- Use themes to group related codes
- Add descriptive memos
- Save your work frequently
Troubleshooting
Conclusion
The Text Annotation Interface provides a robust environment for qualitative data analysis. By following this guide and exploring the various features, you can develop an efficient workflow for your annotation projects. Remember to:
- Save your work regularly
- Organize your codes effectively
- Use the analysis tools to gain insights
- Follow best practices for consistent results
Note: This vignette reflects the current version of the Text Annotation Interface. Features may be updated or changed in future versions.
