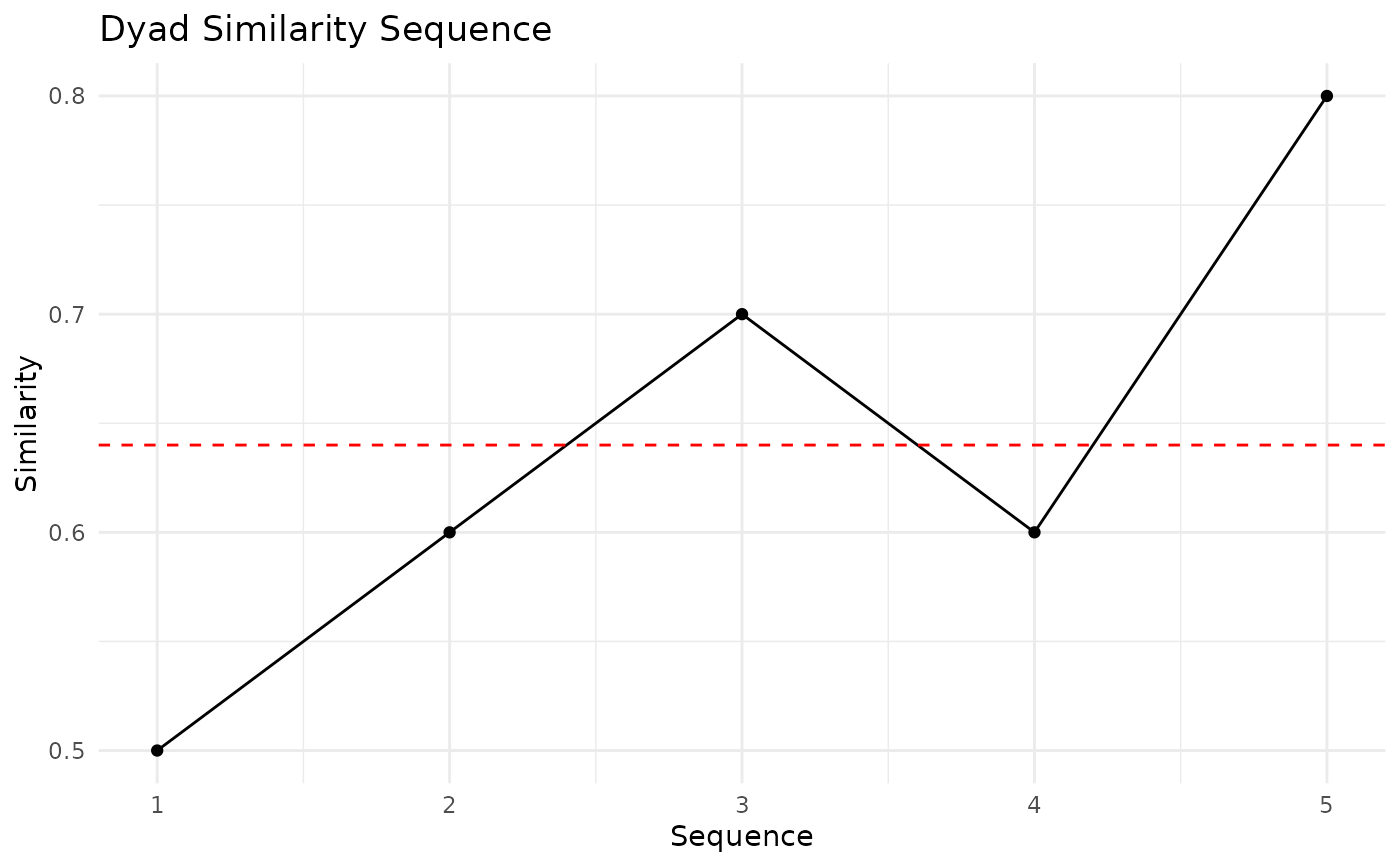
Plot similarity sequence for a single dyad
Usage
plot_sim_seq(similarity, title)
Arguments
- similarity
A list containing the sequence of similarities and the average similarity
- title
A character string for the plot title
Details
This function creates a line plot of the similarity sequence for a single dyad.
Examples
sim_list <- list(
  sequence = c(0.5, 0.6, 0.7, 0.6, 0.8),
  average = 0.64
)

# Plot the similarity sequence
plot <- plot_sim_seq(sim_list, "Dyad Similarity Sequence")
print(plot)
